Monday, April 27, 2009

Population profile

This is an example of a population profile mape. This map is showing the male and femals immigrants that entered the United States in 2004. The light colored blue represents the blue and the dark blue represents the males. Also on the right the ages are listed and broken up in that way. 
http://www.populationaction.org/Publications/Reports/The_Shape_of_Things_to_Come/asset_upload_file420_6098.gif

Scatterplot

This is an example of a scatterplot. This scatterplot map is comparing the age of a husband and wife. The wifes age is shown on the vertical like and the husbands is shown on the horizontal line. 
http://cnx.org/content/m10950/latest/age_scatterplot.gif

Index value plot

This is a example of a index value plot map of the average steam flow index in the United States. This maps shows the average steam flow according to a progress of years. It is easy to see the years when the index is high cause you can see a spike in the chart. 
http://water.usgs.gov/waterwatch/regplots/real/real_us_2.gif

Accumulative line graph or Lorenz curve

This map is a example of an accumulative line graph or Lorenz curve. The graph is showing the comparison between cumulative pervent of income vs. cumularive percent of population. 
http://www.unc.edu/depts/econ/byrns_web/Art/Glossary/LorenzCurve.jpg

Bilateral graph

This is a example of a bilateral graph. This graph is using barline a different colored bars in order to show the difference between accepted trainies, dispatched experts, and dispatch of JOCV's. http://www.mofa.go.jp/policy/oda/category/environment/pamph/2001/image/1_3.gif

Nominal area choropleth map

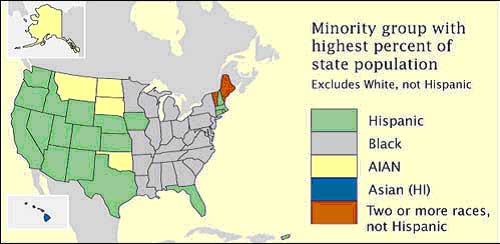
This is an example of a nominal area choropleth map, showing the united states. This choropleth map is trying to display the minority group with the highest percent of state population, excludes whites. The map is using color to identify with each race.
https://courseware.e-education.psu.edu/courses/geog862/images/citationexample.jpg

Unstandardized choropleth maps

This is an example of a unstandardized choropleth map, since the information is random. The viewer is unsure of this area but we are able to view the differen percentage of vacancy by zip code. Also, the percentages are shown through the different colors.
http://www.sfu.ca/unigis/images/price10.jpg